Lane Width and Cars Per Hour Per Lane
I am not qualified to teach anyone about highway engineering, I have a trade-based background, and am only providing references to what you may find helpful in understanding the link between car lane width and number of cars per lane.
First from the U.S. Department of Transport - Lane Width: Flexibility in the AASHTO Guidelines. Urban areas show a high degree of flexibility. It is noted that lane widths "may vary from 10 to 12 feet (3.0 to 3.6 m) for arterials."
For urban roads in New Zealand, kerbside lane widths on straight alignments must be 3.1 m minimum. All other lanes must be at least 3.0 m wide and on corners the lanes should be widened by between 0.3 to 0.9 m as the curve radius changes from minimum R60m to R300m. You can see more details in Table 6.5 in the link below.
The ideal lane width is stated as 3.5m, with 1.8m clearance to fixed obstacles close to the road. When these measurements are reduced, traffic flow is reduced, as shown in the table below from this Transit NZ draft Highway Manual – State-highway-geometric-design-manual Section 6.2 Traffic Lanes
Clearance to fixed obstacle close to road Lane Capacity (% of 3.5m lane capacity) 3.5m lane 3.3m lane 3.0m lane 2.7m lane 1.8 100 93 84 70 1.2 92 85 77 65 0.6 81 75 68 57 0.0 70 65 58 49
The following extract from the Canadian journal of Transportation Vol 4, No 1 (2010) gives some idea of nominal flow.
Abbreviations: Highway Capacity Manual (HCM) and Passage cars per hour per lane (pcphpl)
For lane width, the HCM recommends 3.66m in the ideal case and a reduction of capacity for reduced width. Agent and Crabtree (1983) indicated that lane width might not have any effect on saturation flow for widths more than 3.0m and suggested a 5 per cent reduction in saturation flow for lane widths between 2.7 and 3.0 m. For commercial vehicles no effect was observed even for lane widths below 3.0m. Zegeer (1986) evaluated saturation flow rates on approaches with lane widths varying between 2.6 and 4.7m, and found that saturation flow rate reduces by 2 to 5 per cent for narrower lanes and increases by 5 per cent for wider lanes as compared to standard ones. Potts et al. (2007) investigated the relationship between lane width and saturation flow rate on urban and suburban signalized intersections and observed that saturation flow rate varied significantly with lane width. Average saturation flow rate ranged between 1,736 to 1,752 pcphpl for 2.9m lanes, 1,815 to 1,830 pcphl for 3.3 to 3.6m lanes, and 1,898 to 1,913 pcphpl for lane widths of 4.0m or greater. These saturation flow rates are generally lower than those currently recommended by the HCM. Lewis and Benekohal (2007) suggested that adjustment factors vary from 0.82 to 1.13 for lane widths ranging between 2.8 and 4.0 meters.
The question to ask now is what is the effect on road safety?
My first reference on this comes from the US highway manual Chapter 3.
In a reduced-speed urban environment, the effects of reduced lane width are different. On such facilities, the risk of lane-departure crashes is less. The design objective is often how to best distribute limited cross-sectional width to maximize safety for a wide variety of roadway users
And here is a report on Relationship of Lane width to Safety for Urban and Suburban Arterials, presenting crash data from 590 crashes in Michigan, on two-lane, undivided arterials (2U). There was no change in fatal and injury crashes between 10 foot-wide (3.0m) and 12 foot-wide car lanes (3.3m).
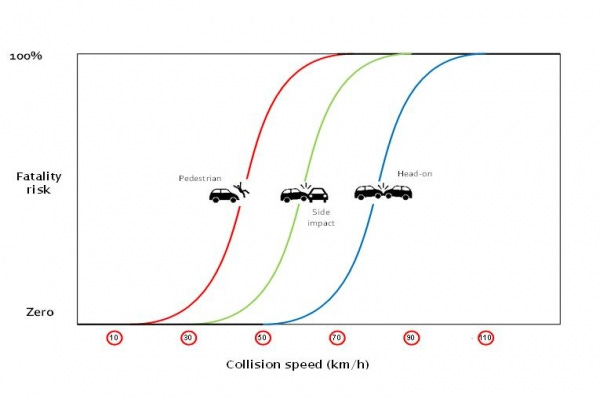
Lastly, the following image from the Greater Wellington Council on survivable-speeds suggests there is little risk of serious injury in car-on-car head-on crashes when speeds drop below 50 kmh.


