Southern Links progress and Ohaupo Rd counts
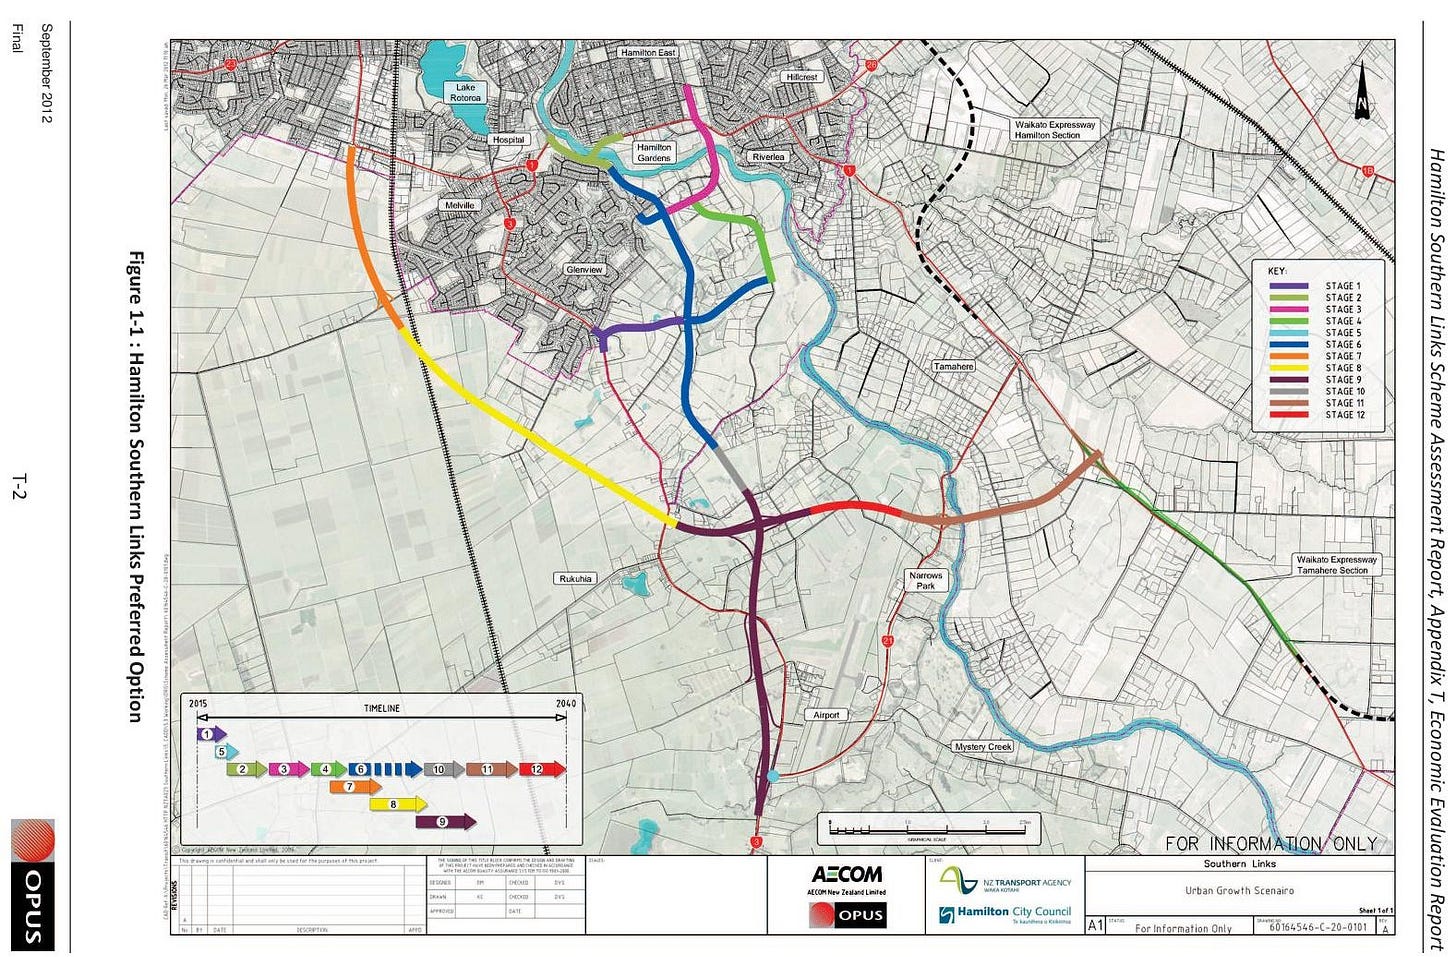
The benefit of the Southern Links project is to ‘enable good long-term planning to be carried out for the city’ (Southern Links website). The project is planned to be staged and is not expected to be finished until the 2040s (*p.236). In the 2013 report* the Benefit / Cost Ratio (BCR) for the Hamilton Southern Links Preferred Option was calculated at 2.0. (*p.212, 227, 230), or somewhere between 1.6 and 3.5 (*p.230, 231), or 1.8 (*p.254). Whichever calculation is used, in 2013 it had been determined that investment would produce a return.
*Southern Links Investigation NZTA / HCC 22-Nov-2013 Transport Modelling Report
Here is how I see progress: 1 Central Arterial Ward (Ohaupo roundabout**), 2 Cobham Drive (Not done), 3. Ring Road Link (Bridge**), 4 Peacocke Minor (Being built**), 5 SH 2 Airport (Done), 6 Peacocke Major (part being built ahead** of 7), 7 Western Link 1 (Greenwood to Collins Rd), 8 Western Link Stage 2, (Collins Rd to Ohaupo Rd), 9 SH3 Realignment, 10 SH3 – Peacocke Major, 11 Eastern Link Stage 1, 12 Eastern Link Stage 2.
**Peacocke Development Activity Oct 2023 from - Strategic Growth and District Plan Committee Tuesday 10 Oct 23 (p.97)
The next planned project is 7, Western Link 1 (Greenwood to Collins Rd). Its timing slot has been taken by 6, Peacocke Major, and the Western Link (Greenwood to Collins to Ohaupo) is now waiting for funding. I now want to look at the predicted 2041 traffic flow on Ohaupo Rd between the city boundary and Kahikatea Drive, which the Greenwood to Ohaupo (Western) link will change.
There are four traffic counts on the Southern Links daily traffic flows for 2041 (circled in red). Note that this traffic flow map is without the Greenwood-Collins-Ohaupo bypass being built. The Hamilton City Council Traffic count map (Link) allows us to see traffic trends for seven places along SH3 Ohaupo Rd. Below I assess what trends still line up with the 2041 predictions.
The above first count on the hill above the new roundabout is on track: without the bypass the trend line hits the predicted number. There is also a map of flow with the bypass (link), which predicts a traffic flow of only 4,100 vehicles per day (vpd).
This second count by Glenview New World gives mixed results: while the 2006 counts show higher than predicted traffic flow trends, the 2000 to 2022 trend line is flat-lining. Using the 2018 to 2022 trend line I can make it look like traffic flow will reduce the ‘with G-C-O bypass number of 13,500 vpd’ without building the bypass.
This third count of 40,100 is predicting an extra 12,500 (a 45% increase in vehicles***) entering Ohaupo road from Lambert Ct (New World) and the Saxby / Tomin road roundabout. I can only find numbers from 2018 to 2022 that show counts. These counts are a bit ad hoc, showing a decline in the pre-Covid years. I would suggest the 40,100 needs a closer look and the 2023 traffic count needs to be added to see how the trend line changes.
***between 2018 and 2022 the increase was between 28 and 39%.
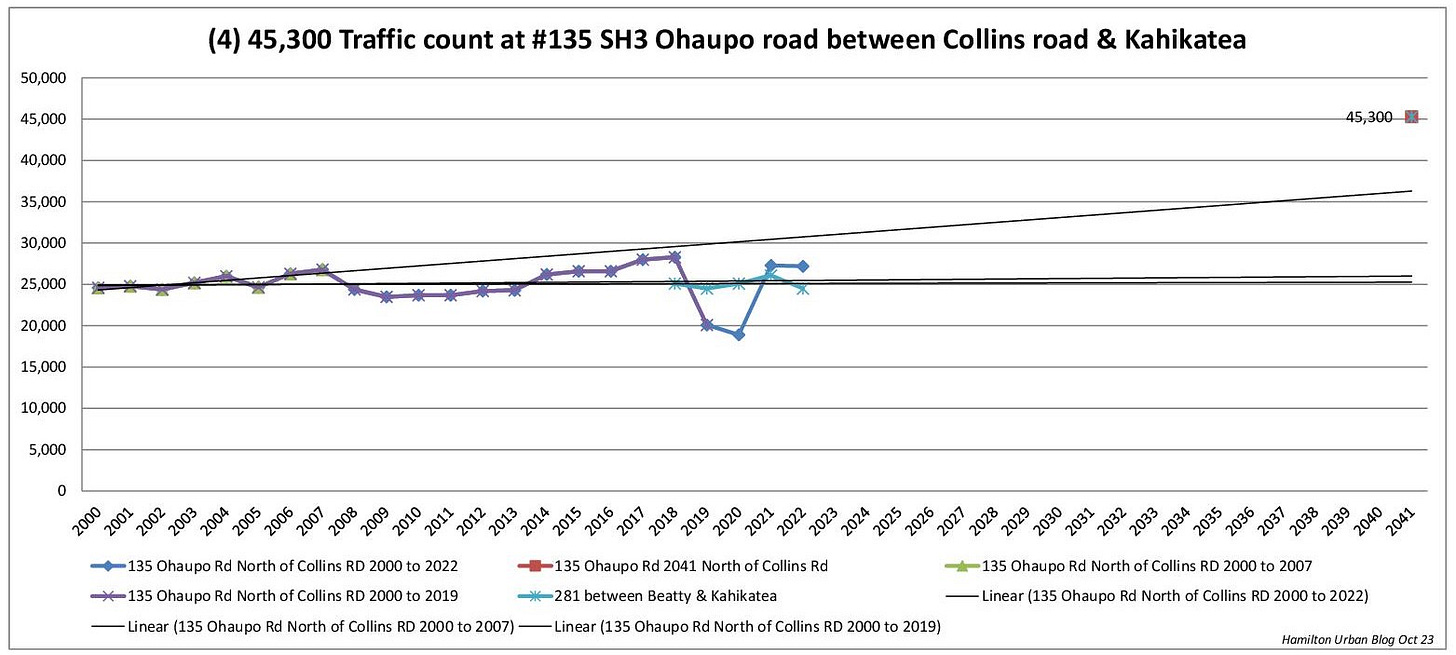
This fourth count adds another 5,200 motor vehicles to Ohaupo Rd from Collins Rd. By being selective with dates I have tried to find where this number comes from by excluding the 2008 dip, and then excluding the 2019 dip, but neither of these gets to the 45,300 vehicles per day that is planned for.

Summing up: Building the western bypass is not going to address the large increase in traffic flow north of the Glenview New World (counts 3 and 4). This is local traffic, and we need ongoing checking of pedestrian desire lines, road crossings, whether footpath and cycle lane widths feel safe, and that parents' perceptions of safety allow their children to travel independently of adults, so we do not increase the mode shift toward more motor vehicles.


