Greenwood St traffic count statistics
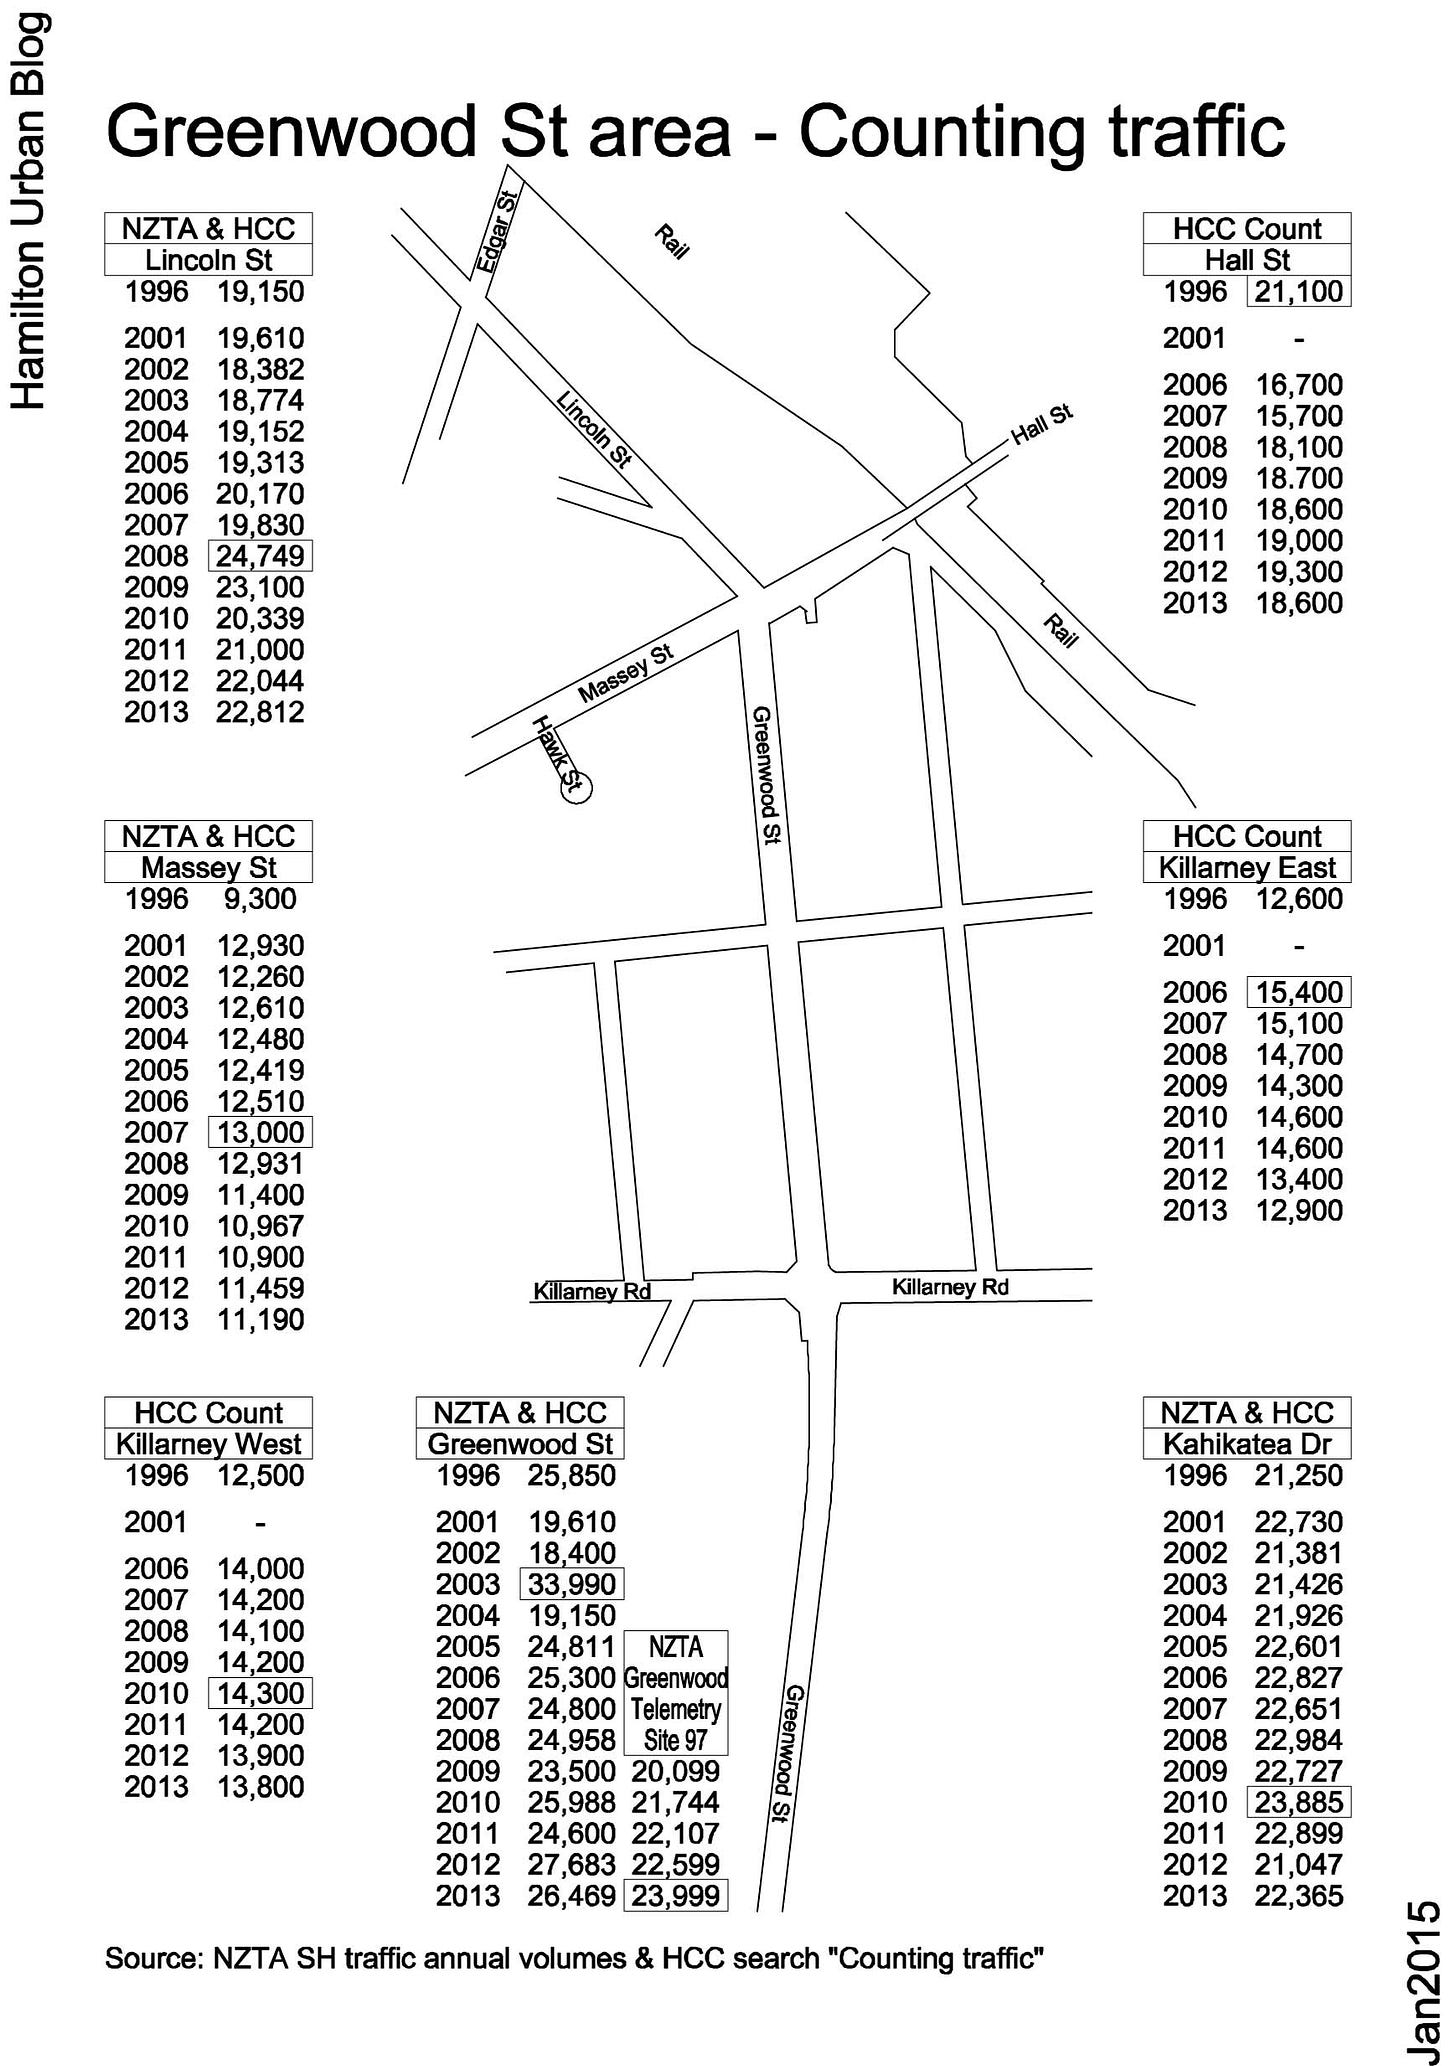
Greenwood St is home to telemetry site 97, one of 117 carefully selected locations around New Zealand that collect continuous data on vehicles per day, helping NZTA to understand travel patterns. This site has been showing year on year growth from when it was installed, the figures being: 2009 (20,099); 2010 (21,744 up 8%); 2011 (22,107 up 1.6%); 2012 (22,599 up 2.2%); 2013 (23,999 up 6.1%); 2014 (24,864 up 4.0%). This represents an average yearly increase of 4.4% over the last 5 years.

There are other traffic counting sites in the Greenwood Street area, some managed by Hamilton City Council and others by NZTA, which show both increases and decreases.

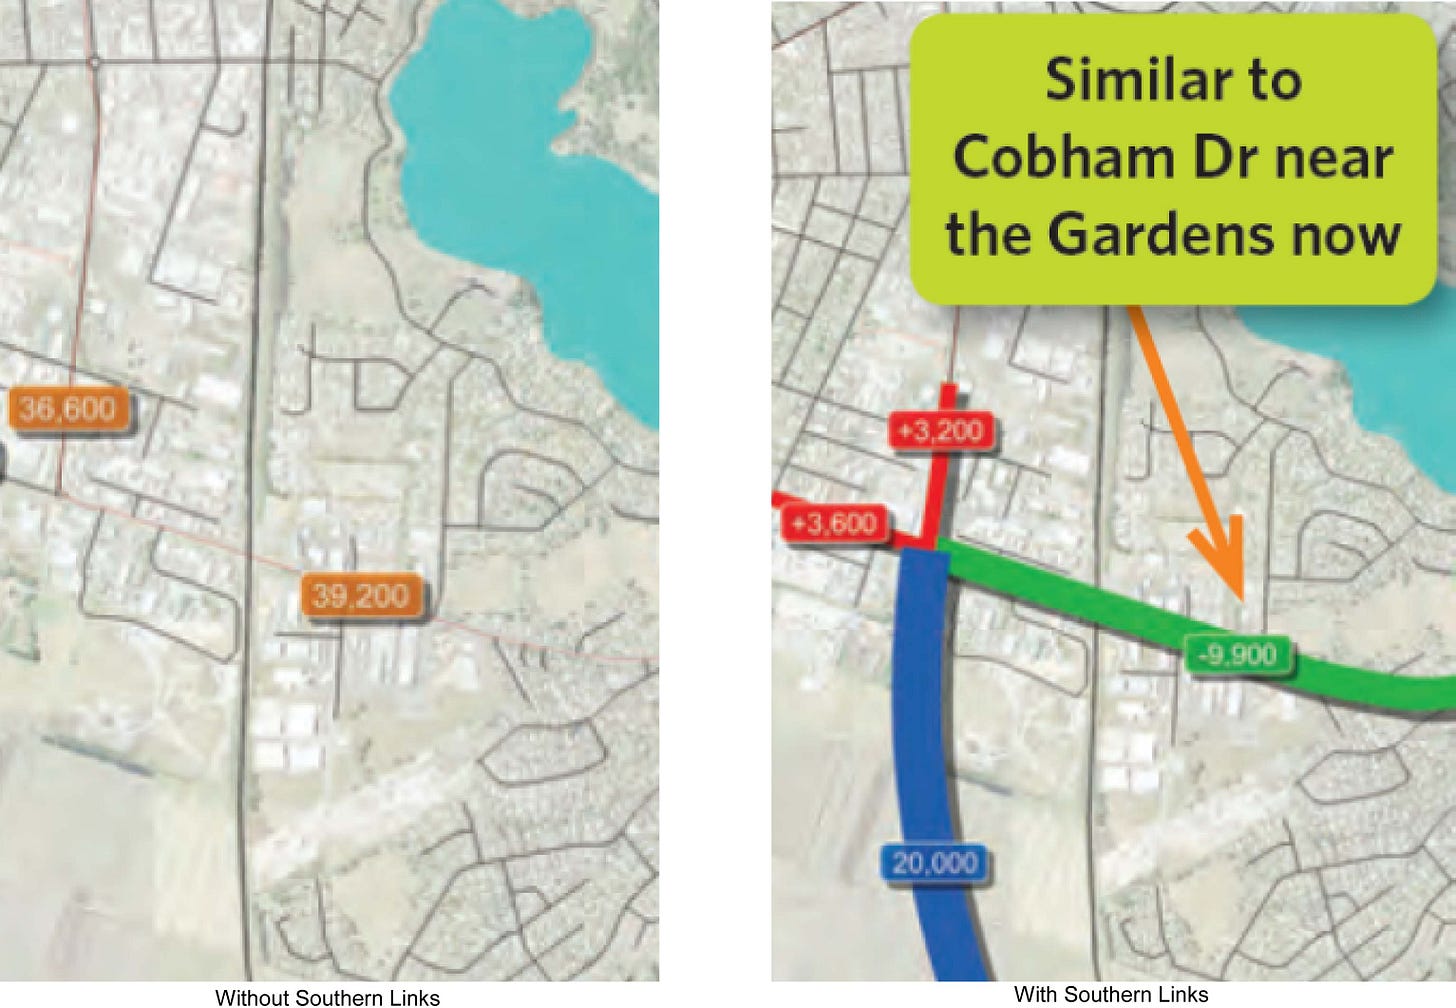
NZTA has published predictions of growth as part of its planning for the Southern Links notice of requirement - NZTA Map Southern Links traffic flows 2041 created Jun 2012

Southern Links daily traffic flow in 2041 These predictions estimate daily traffic counts, in 2041, between 36,600 to 39,800 for Greenwood St and 29,300 to 39,200 for Kahikatea Dr. Past Post: Southern Links - Kahikatea Dr Ohaupo Rd - Sep 2014


