


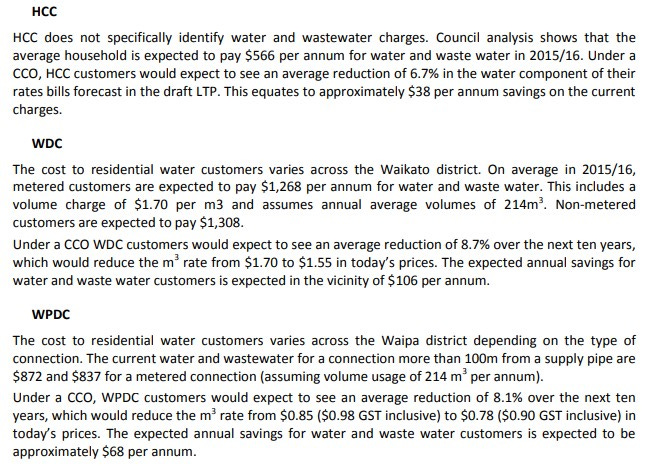
City Water – Long term planning

Lewis Mumford’s book The Culture of Cities (1938) states: ‘The most obdurate [stubborn] form of local control is that of the drinking water supply (p. 316) ... Water had become too much a matter of public concern in big cities to be left to the supply of individual water companies” (p. 424)
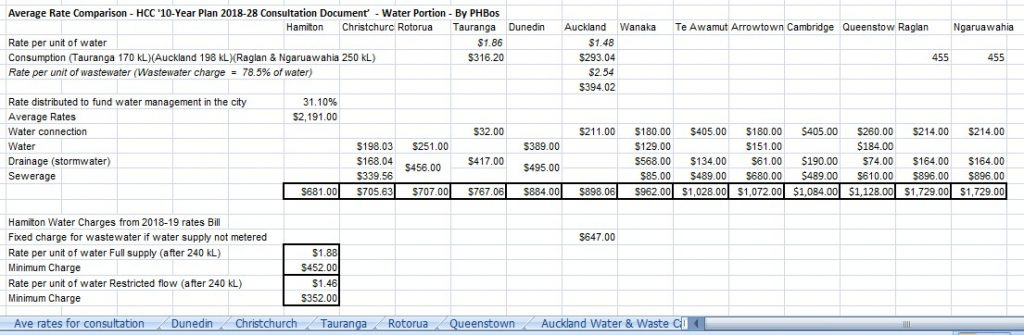
In Hamilton’s ‘10-Year Plan 2018-28 Consultation Document’, page19 features a chart showing the average residential rates for fast-growing cities. Hamilton’s average is $2,191. Council kindly provided me with the spreadsheet that was used to create the comparison, and from this I have tried to separate out the water management costs. The $681 for Hamilton is based on the 2018-19 rates bill that states 31.1% of rates distributed funds go to water management. The 2019-20 rates bill now puts it at 34.2%, which increases water management costs to a nominal $750 per rate payer. DISCLAIMER: Greater Auckland* also put together a rate comparison graph, which puts Hamilton’s rate as above average, while the Hamilton City Council one showed the opposite. All numbers should be read as nominal. You can find more on Hamilton’s Water supply charges here (link)
*Greater Auckland ‘Emergency Budget’ 15 June 2020 ‘rates payable in different NZ cities’
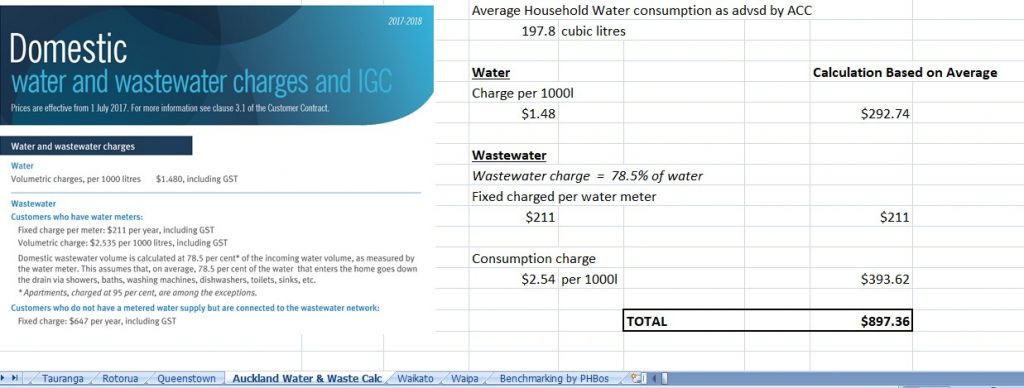
In Auckland, waste water is charged at 78.5% of the metered water in, and ‘Apartments [are] charged at 95 percent’. I read this as a 5% water loss or does not go into wastewater system, which is similar to Amsterdam’s (5,000 people per km2) water loss claim of less than 5%**, compared with Singapore at about 10%**, and East Anglia at 16%**. This shows how wasteful urban sprawl is compared to higher density living. In Hamilton, ‘During summer months an estimated 50 to 70 per cent of household water is used outdoors for watering lawns and gardens’ (p. 8***). My notes show that in the year 2012-2013, Hamilton took 21,260,860 m3 of water from the Waikato River (split 14,514,803 m3 to residential / 5,954,244 m3 to metered properties) and discharged 16,970,323 m3 of treated effluent to the Waikato River; a 20% loss. Compare this to the UK, which claimed to be about 25%**,the EU average of 23%** or Auckland’s 21.5%.
**BBC radio4 The Bottom Line –Water – 20 Jul 2013, from minute 10:00
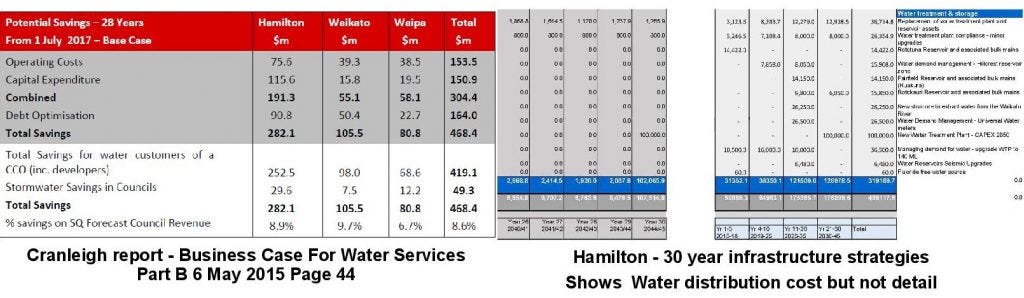
Possible savings from the 3 water joint study 2015 Cranleigh report (part B) include: ‘The reduction in customer water and waste water charges is estimated at between $96m (7.5%) and $124m (9.7%) in the first ten years’ (p. 41) ... The plan is that ‘The Councils currently employ 217 FTE staff in water activities; it has been determined that during a transition period of three years staff numbers can be reduced to 181 due to efficiencies’ (p. 25). The report also proposes a that with a reduction in capital spending of between $41m and $68m in the first ten years (p. 51) and spreading debt over ‘three or four generations ... it is entirely prudent for a water utility to raise proportionally more debt than a council and repay it over a longer period’ (p46). In the first five years of the 2018-28 long term plan, capital spending jumped $75m above the information the Cranleigh report based its calculations on, wiping out any savings.
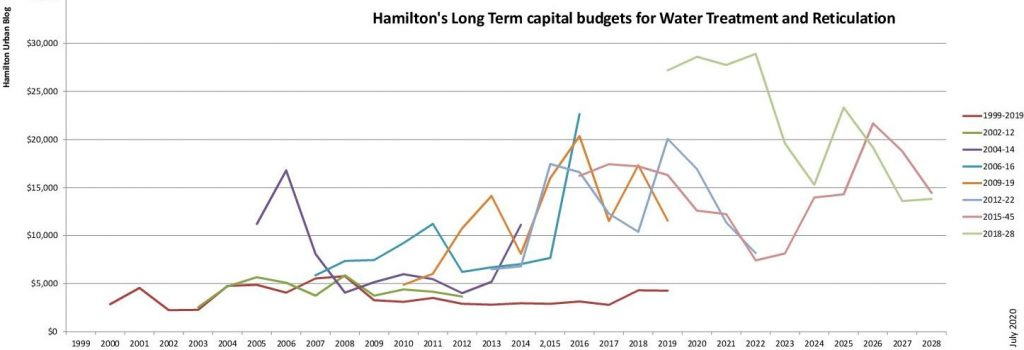
The Cranleigh report uses a 28-year time frame: ‘We have evaluated the options over a 28 year period given the long term nature of water infrastructure and the information base available. This includes council draft LTPs and 30 year infrastructure strategies’ (p13). In year 30 of Hamilton’s 30-year infrastructure strategies $100m was budgeted for a new water treatment plant. If the Cranleigh report was based on the 30-year infrastructure strategies time frame, much of the reported savings for Hamilton is needed for future infrastructure expenditure.
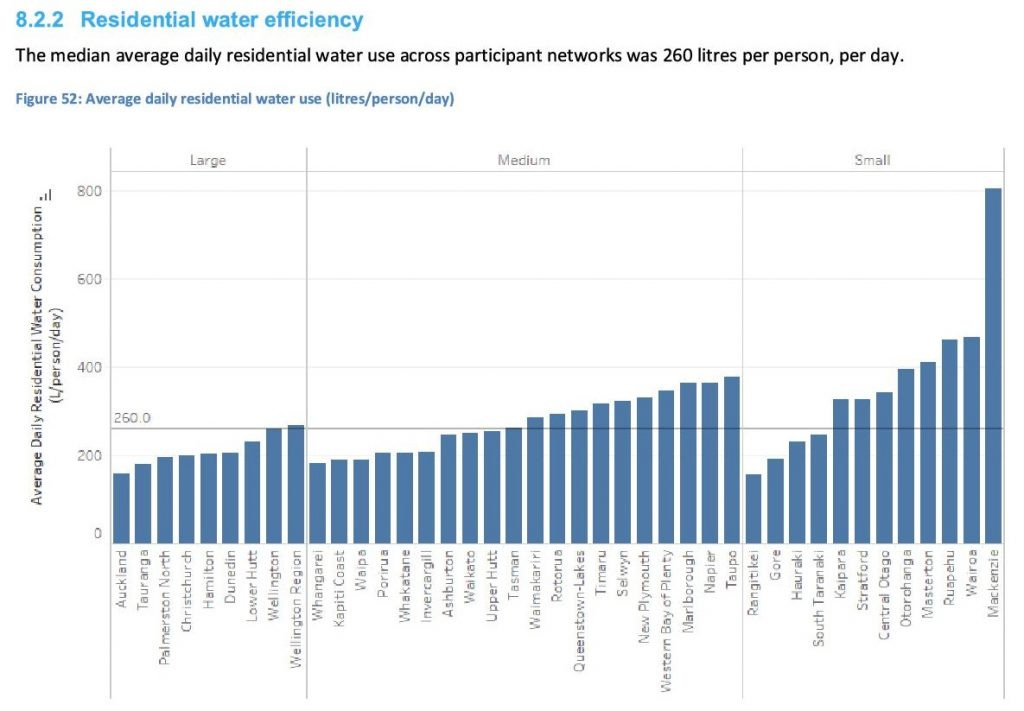
Metering - The BBC podcast on Water** suggested water meters produce a 12 to 15% reduction (minute 7**) in use in the first year. In the UK average person uses UK 150L (125L per day metered) or 54.8k (45.6k per year metered). In Europe the standout is the Czech Republic at 100L per day per person or 36.5k per year (minute 25**). Page 78 of Hamilton’s 2012-22 long term plan indicates ‘224L per person per day’. Adding water meters would bring Hamilton in line with Auckland, but this is still a long way from the UK. Hamilton needs to think further about water meters or a separate water company if it wants to be water smart.
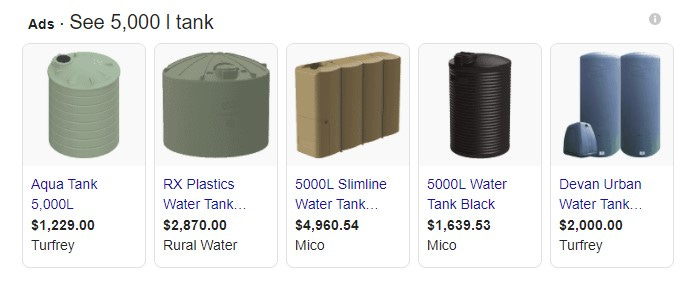
The 2017 District plan, under 25.13.4.5 Water Efficiency Measures, includes the option of rainwater tanks (at least 5,000 L capacity) to create a non-potable reuse system. On average Hamilton builds 1,400 new dwellings per year. By using rainwater tanks for non-potable systems we would get approximately a ~30% reduction in treated water use (Water Household guide P8), bringing us close to the UK unmetered levels and better than other fast-growing cities in New Zealand.
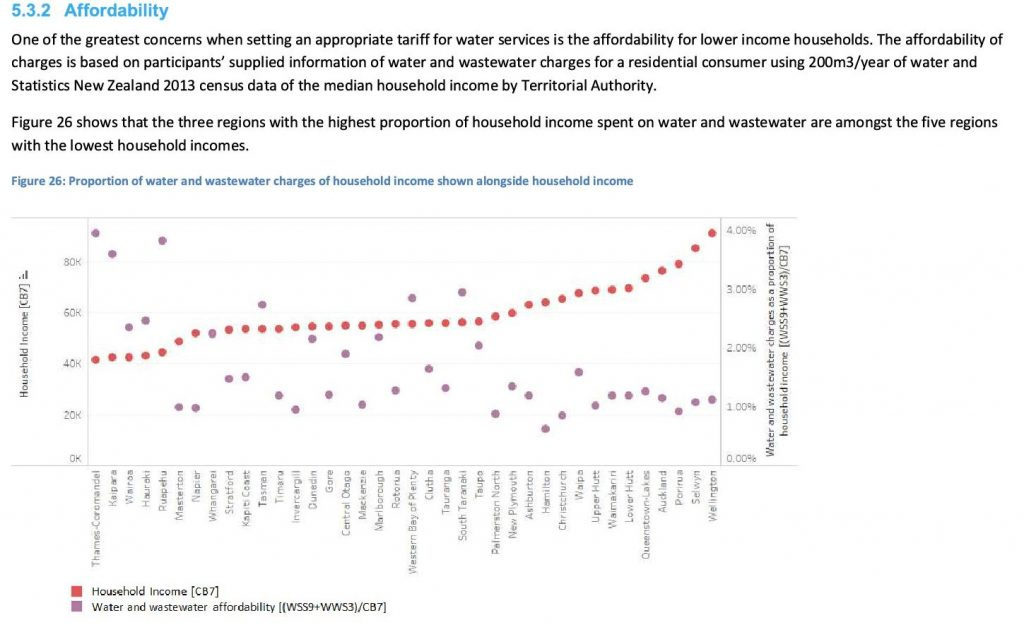
Extra bench marking on affordability and water use from National performance review of Water 2016-17 which show Hamilton in a good place
End